1.1.1 Basic properties of a plane wave
The ppw1.QWpro model should be loaded to QW-Modeller and the electromagnetic simulation in QuickWave needs to be run. The simulation is run with default parameters of the model, by pressing ![]() button from Simulation tab.
button from Simulation tab.
QW-Simulator runs with Log window opened and Log Output tab active. Detailed description of all output comments written in the log window can be found in QuickWave manual. Press ![]() button in 2D/3D Fields tab of QW-Simulator to open fields visualisation window and observe the propagating wave. Maximise the window for your convenience. In the window visible are: the structure and a cross section through the middle of the parallel plate line, in the plane parallel to the direction of wave propagation to enable convenient visualisation. Enable continuous display refresh by pressing
button in 2D/3D Fields tab of QW-Simulator to open fields visualisation window and observe the propagating wave. Maximise the window for your convenience. In the window visible are: the structure and a cross section through the middle of the parallel plate line, in the plane parallel to the direction of wave propagation to enable convenient visualisation. Enable continuous display refresh by pressing ![]() icon (or by pressing "D" from keyboard). In the widow title bar "/DYN" should now appear.
icon (or by pressing "D" from keyboard). In the widow title bar "/DYN" should now appear.
The field component that is currently displayed is Ex, which in the considered case stands for the electric field component parallel to the direction of wave propagation. According to Property 2 of a plane wave, electric and magnetic fields are perpendicular to the direction of wave propagation, that is why the Ex component is zero. Switch to Ez and then to Hy components by clicking the appropriate buttons in the Components tab: 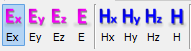 . Those two components obey the Property 2 of a plane wave, thus when displayed the moving sinusoidal wave can be seen. We recommend adjusting the magnitude of the displayed component using
 ![]() button. The exemplary display of the electric field component is shown Fig 2.
button. The exemplary display of the electric field component is shown Fig 2.
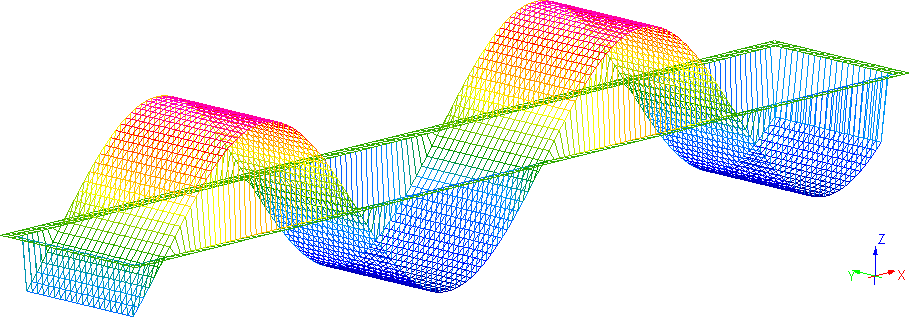
Fig 2 Example of Ez component of electric field.
The display confirms that the wave propagates in ![]() direction and the electric and magnetic fields are along
direction and the electric and magnetic fields are along ![]() directions respectively, what proves the Property 3 of a plane wave.
directions respectively, what proves the Property 3 of a plane wave.
It should be reminded that the frequency set for this model is 4GHz, thus the wavelength in a free space is calculated as follows:
![]()
This value can be confirmed in the simulation. Press ![]() button in 1D Fields tab to open 1D Fields window and then change the display to show Ez component. Suspend the simulation by pressing
button in 1D Fields tab to open 1D Fields window and then change the display to show Ez component. Suspend the simulation by pressing ![]() button. Fig. 3 shows the display in a random simulation moment after suspending the calculation. To calculate the wavelength it is required to measure the distance between two nearest points of the same phase. It is done using markers (blue and red) and the distance is read on the left side of the window. In this case
button. Fig. 3 shows the display in a random simulation moment after suspending the calculation. To calculate the wavelength it is required to measure the distance between two nearest points of the same phase. It is done using markers (blue and red) and the distance is read on the left side of the window. In this case ![]() what is consistent with the theoretical calculations.
what is consistent with the theoretical calculations.
The QW-Simulator can be now closed.
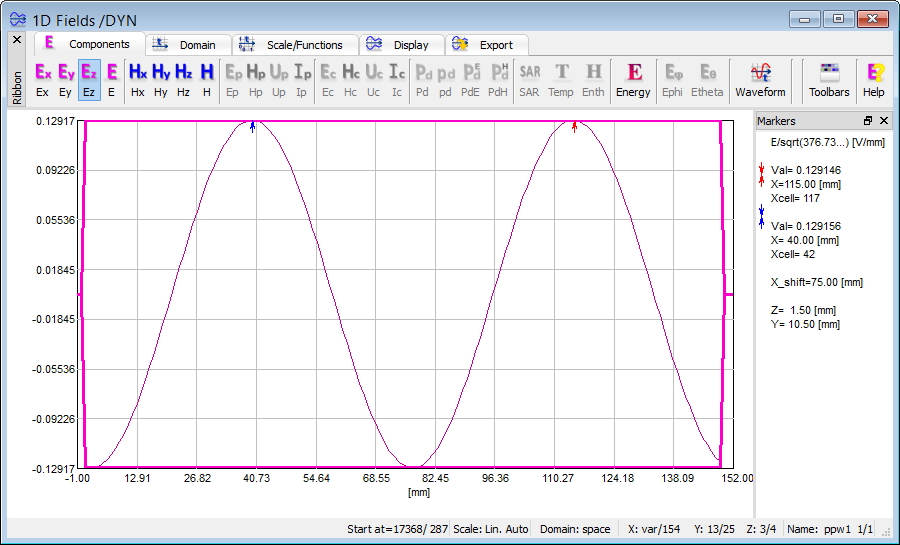
Fig 3 Example of 1D view of Ez component.