1.1.2 Relation between a frequency and a wavelength
The formula for a wavelength calculation has been confirmed with simulation. Now the dependence between a frequency and a wavelength will be investigated. For that purpose you can open a ready to run ppw2.QWpro file or open and modify the ppw1.QWpro example in QW-Modeller. If you are modifying ppw1.QWpro file, change the excitation parameters using dialogue windows of respective ports, which can be edited from the project tree (see Fig 4). Click over Ports (to unfold the menu) and double click over the SourcePort port to open its configuration dialogue (see Fig 5). In the Parameters tab we set the excitation frequency to 8 GHz. The same change should be done for LoadPort port. Save the project with a new name and run simulation by pressing ![]() in Simulation tab.
in Simulation tab.
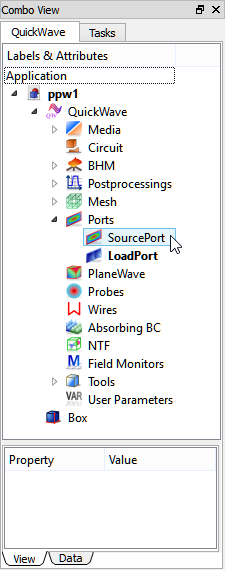
Fig 4 ppw1.QWpro project tree.
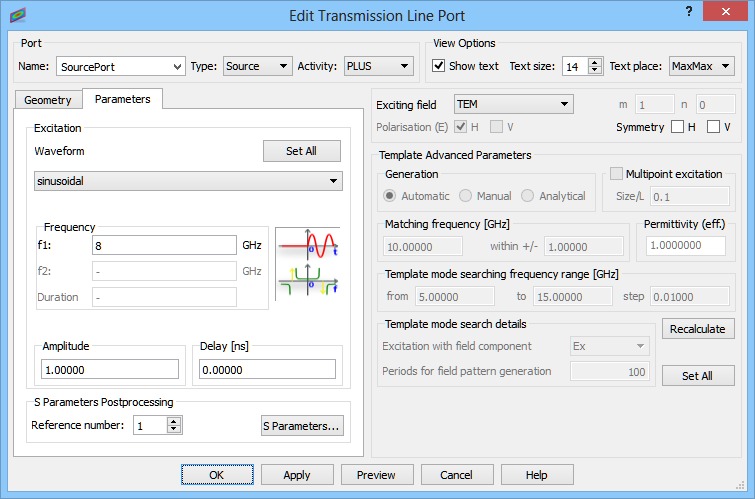
Fig 5 Port properties dialogue.
The wavelength should be measured as previously (open 1D display window with ![]() button, pick the correct component, suspend the simulation, mark two points of the same phase). The result of this measurement is shown in Fig 6.
button, pick the correct component, suspend the simulation, mark two points of the same phase). The result of this measurement is shown in Fig 6.
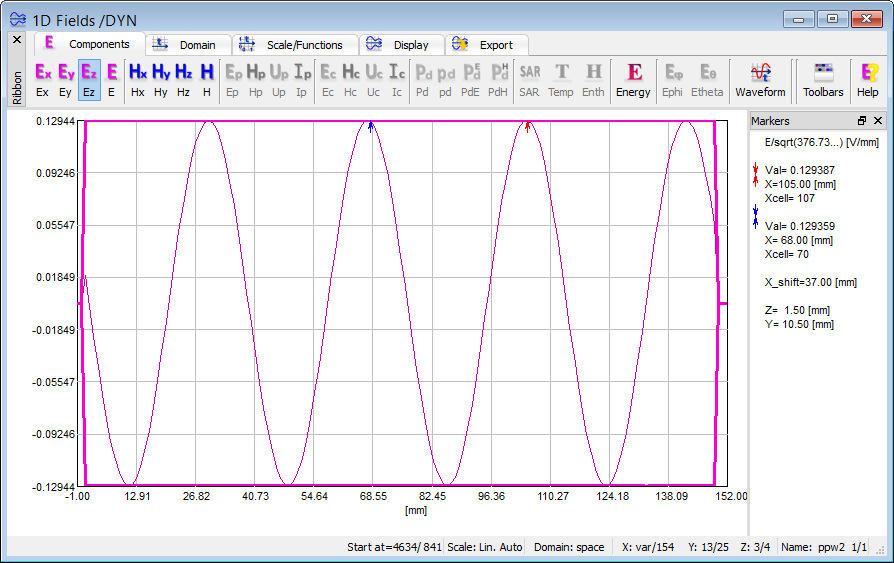
Fig 6 Measurement of wavelength at 8GHz.
The theoretical wavelength is:
![]()
and it differs from the value calculated in simulation. This discrepancy is due to the space discretisation setting, which directly determines the accuracy of wavelength calculation. In the considered case the cell dimension in the direction of wave propagation equals 1 mm and that is the limit of wavelength calculation accuracy.