
2.2 Waveguide mode
Waveguide mode stands for a unique distribution of transverse and longitudinal components of the electric and magnetic fields. There are two types of waveguide modes that can propagate in the waveguides: TE (Transverse Electric) and TM (Transverse Magnetic). In TE modes only transverse (perpendicular to the direction of propagation) electric field exists and there is no longitudinal (along propagation direction) component, and the magnetic field exists in all directions. For TM modes we deal with only transverse magnetic field and the electric field exists in all directions.
At this point it is also worth mentioning about a fundamental waveguide mode. The fundamental waveguide mode is the wave mode with the lowest cutoff frequency. In case of rectangular waveguides it is TE10 (called also H10 since a longitudinal component of magnetic field exists).
The waveguide modes will be investigated with QuickWave software. Run QW-Modeller and load wr340.QWpro project containing rectangular waveguide WR-340. The default excitation settings for this scenario can be viewed after unfolding Ports element group in the project tree (see Fig. 1) and editing the settings of available ports. The SourcePort is an excitation port delivering the energy to the waveguide. The LoadPort is a matched load, in which the energy is absorbed. Open the SourcePort settings window by double clicking on its name. The dialogue as in Fig. 2 will appear.
Fig. 1 Project tree of wr340.QWpro
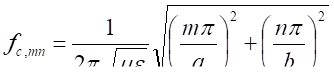
Fig. 2 Port settings dialogue for SourcePort port
In Template Advanced Parameters the analytical option for template mode generation is enabled. The waveguide mode type to be generated is chosen from the Exciting field list to be Rect_TE, what stands for TE mode in rectangular waveguide, and the dominant mode TE10 is chosen by setting m=1 and n=0. In the Parameters tab the Excitation Waveform is chosen to be sinusoidal and frequency is set to 2.5 GHz, which is above the cutoff frequency (1.73 GHz) for a TE10 mode in a WR-340 waveguide. The LoadPort has the same excitation parameters.
For the investigation of fields’ distribution, the electromagnetic simulation in QuickWave Simulator should be run from Simulation tab using Start ![]() button as shown in Fig. 3.
button as shown in Fig. 3.
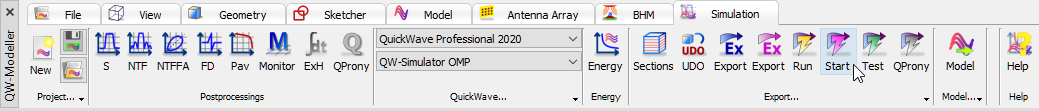
Fig. 3 Simulation tab in QW-Modeller
The QW-Simulator window with Simulator Log window and Log Output tab active will open. The description of all the information written in the log tab can be found in QuickWave manual.
Figures 4-10 show the distribution of the electric and magnetic fields for TE10 mode in the analysed waveguide. The consecutive displays may be viewed by pressing ![]() button in 2D/3D Fields tab of QW-Simulator for several times (once for obtaining each of the following displays) and observe the fields in the fields visualisation window. For the visualisation convenience the display windows may be maximised. It can be clearly seen (Fig. 4) that electric field reaches its maximum in the middle of waveguide’s width and zero at the side walls. Thus one half of a sinusoid can be recognised along waveguide’s width (m=1) and no field variation along waveguide’s height (n=0). From the displays it is clearly seen that only magnetic field has a longitudinal component (along direction of wave propagation – X direction), which confirms that the propagating mode is a TE mode.
button in 2D/3D Fields tab of QW-Simulator for several times (once for obtaining each of the following displays) and observe the fields in the fields visualisation window. For the visualisation convenience the display windows may be maximised. It can be clearly seen (Fig. 4) that electric field reaches its maximum in the middle of waveguide’s width and zero at the side walls. Thus one half of a sinusoid can be recognised along waveguide’s width (m=1) and no field variation along waveguide’s height (n=0). From the displays it is clearly seen that only magnetic field has a longitudinal component (along direction of wave propagation – X direction), which confirms that the propagating mode is a TE mode.
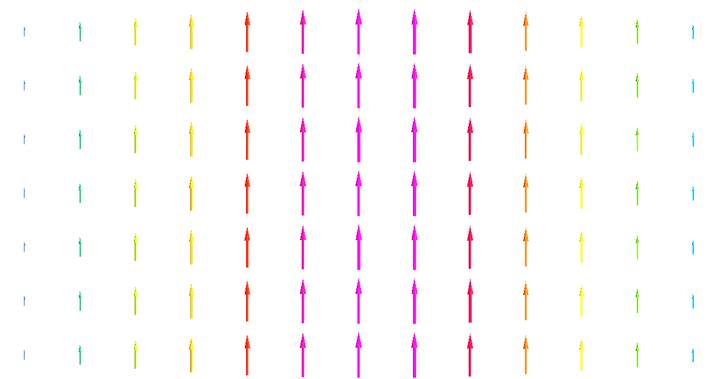
Fig. 4 A vector display of electric field distribution for TE10 mode in a cross section of rectangular waveguide (ZY plane).
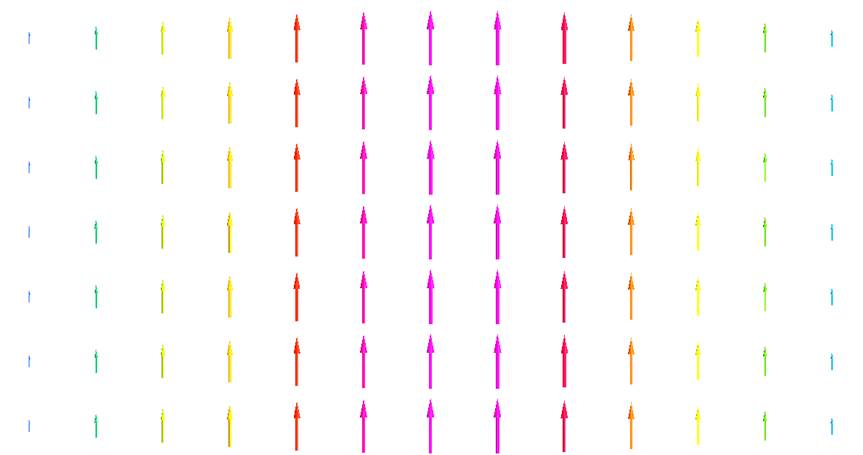
Fig. 5 A vector display of magnetic field distribution for TE10 mode in a cross section of rectangular waveguide (ZY plane).
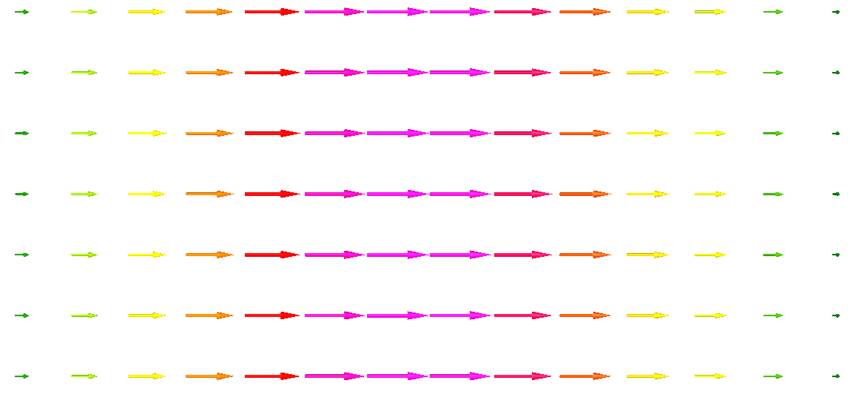

Fig. 6 A vector display of electric field distribution for TE10 mode along rectangular waveguide (YX plane- in the middle of waveguide’s height)
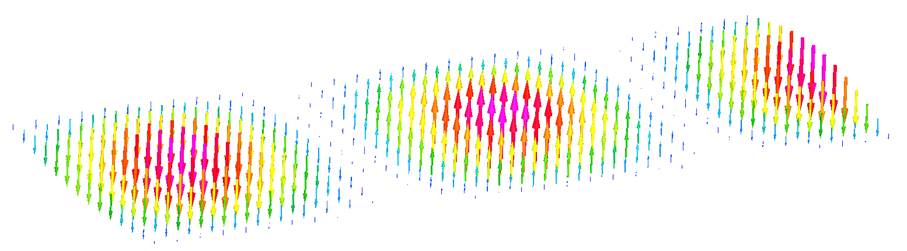
Fig. 7 A vector display of magnetic field distribution for TE10 mode along rectangular waveguide (YX plane- in the middle of waveguide’s height)
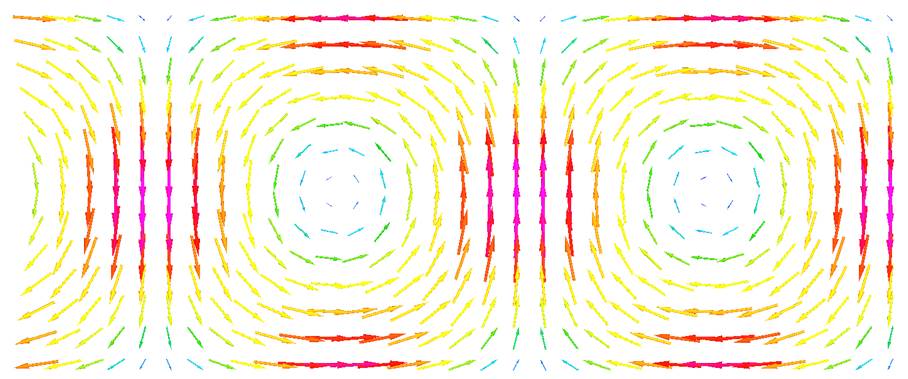
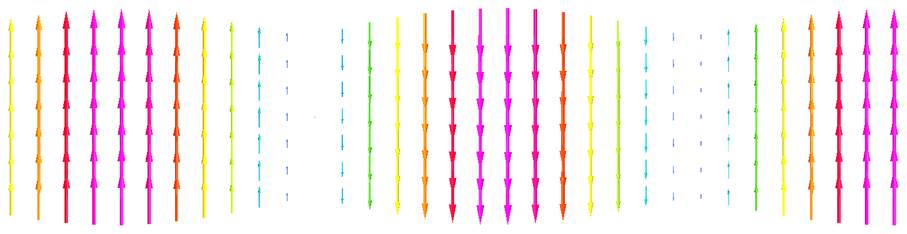
Fig. 8 A vector display of electric field distribution for TE10 mode along rectangular waveguide (ZX plane- in the middle of waveguide’s width)
(a)

(b)
Fig. 9 A vector display of magnetic field distribution for TE10 mode along rectangular waveguide (ZX plane): in the middle of the waveguide’s width (a) and near the waveguide’s wall (b).
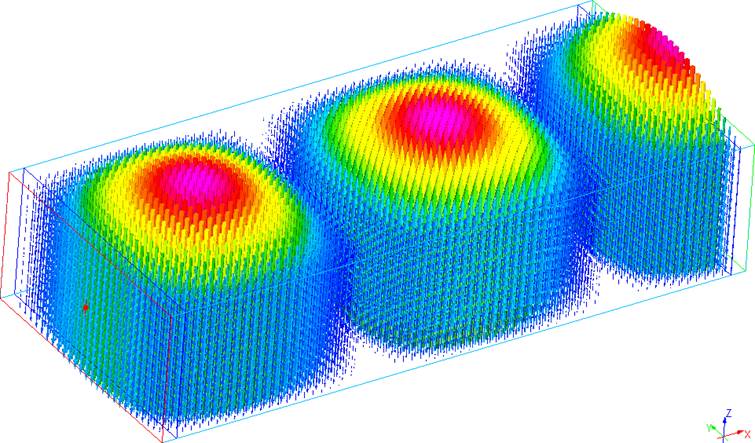
Fig. 10 A vector display of electric field distribution for TE10 mode along rectangular waveguide.