
2.3 Higher order modes
In this part it is recommended to excite one of the higher order modes to feel confident in understanding and recognition of waveguide modes.
Load wr340_TM.QWpro model in QW-Modeller. In this case the TM43 mode is considered.
Note that when the waveguide mode is changed, the excitation frequency needs to be modified, so that it is above the cutoff frequency for a given waveguide. In case of the considered TM43 mode the cutoff frequency is:
In this case the excitation frequency is set to 15 GHz. Note that the Matching frequency parameter available in Template Advanced Parameters frame should be always set to be above the cutoff frequency. Here for the convenience it is also set to 15 GHz (more information about the Matching frequency and the template generation procedure can be found in QuickWave manual). Figures 11-17 show the distribution of the electric and magnetic fields for TM43 mode in the analysed waveguide at 15 GHz. The consecutive displays may be viewed by pressing ![]() button in 2D/3D Fields tab of QW-Simulator for several times (once for obtaining each of the following displays) and observe the fields in the fields visualisation window. For the visualisation convenience the display windows may be maximised. It can be seen (Figs. 11 and 12) that there are four sinusoid halves recognised along waveguide’s width (m=4) and three sinusoid halves along waveguide’s height (n=3). It is also well noticed that only the electric field has a non-zero component along direction of wave propagation (X direction).
button in 2D/3D Fields tab of QW-Simulator for several times (once for obtaining each of the following displays) and observe the fields in the fields visualisation window. For the visualisation convenience the display windows may be maximised. It can be seen (Figs. 11 and 12) that there are four sinusoid halves recognised along waveguide’s width (m=4) and three sinusoid halves along waveguide’s height (n=3). It is also well noticed that only the electric field has a non-zero component along direction of wave propagation (X direction).
It is recommended to switch between FDTD layers in each observation plane (using L and K keyboard buttons for going up and down along layers respectively) to observe how the field distribution changes along waveguide’s dimensions.

Fig. 11 A vector display of electric field distribution for TM43 mode in a cross section of rectangular waveguide (ZY plane).
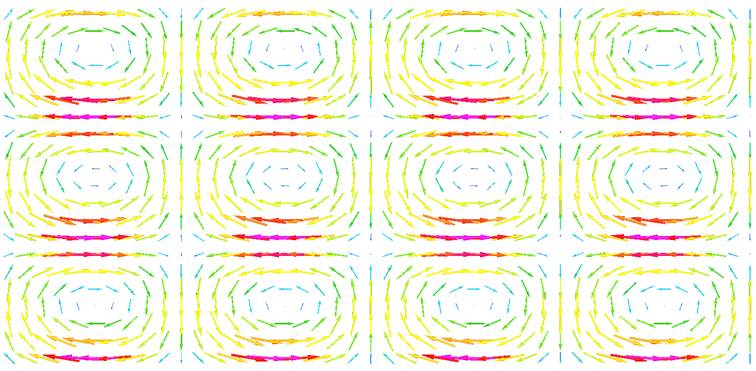
Fig. 12 A vector display of magnetic field distribution for TM43 mode in a cross section of rectangular waveguide (ZY plane).

Fig. 13 A vector display of electric field distribution for TM43 mode along rectangular waveguide (YX plane- in the middle of waveguide’s height).
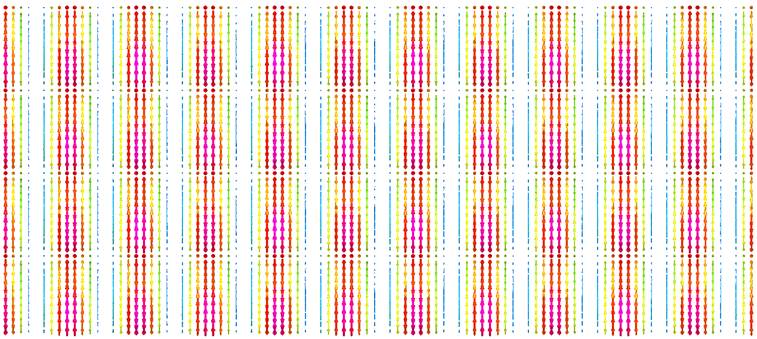
Fig. 14 A vector display of magnetic field distribution for TM43 mode along rectangular waveguide (YX plane- in the middle of waveguide’s height).
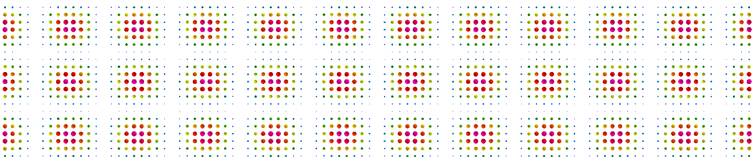
Fig. 15 A vector display of electric field distribution for TM43 mode along rectangular waveguide (ZX plane- in the middle of waveguide’s width).
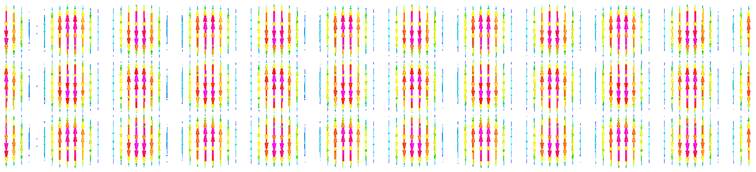
Fig. 16 A vector display of magnetic field distribution for TM43 mode along rectangular waveguide (ZX plane- in the middle of waveguide’s width).

Fig. 17 A vector display of electric field distribution for TM43 mode along rectangular waveguide.