2.4 Optimisation Progress
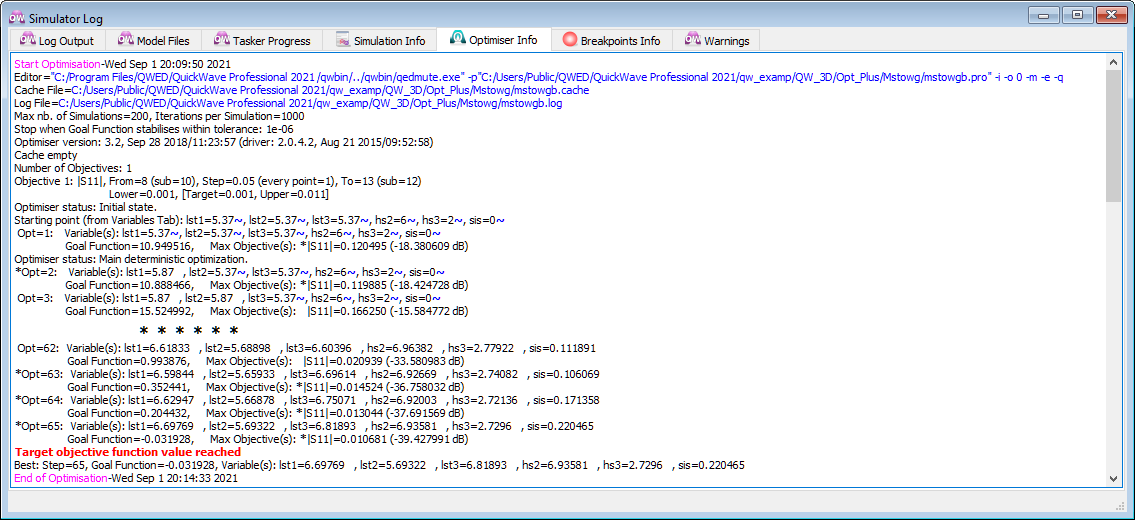
During optimisation routine, the basic information about it is displayed in the Optimiser Info tab of the Simulator Log window. The first batch of information is provided upon the start of the process. It includes the Maximum number of simulations, the Stop Criterion, the state of Cache, the Objectives and initial values of the Variables. If optimisation cannot be started, an explanation is given. After each Simulation is completed we can see in the log:
· Number of consecutive optimisation runs (e.g. Opt=3). If accompanied by an asterisk (e.g.*Opt=3), it means that this particular attempt has given the best result so far (with the lowest value of the Goal Function).
· The current value of the Goal Function.
· The current values of the Variables (only those marked in Configure Optimiser dialogue to be Shown). If the value is marked with a blue tilda ~, it means it is within resolution from the Value in the Variables tab. If the value is marked with a green plus +, it means it is within resolution from the Upper in the Variables tab. If the value is marked with a red minus -, it means it is within resolution from the Lower in the Variables tab.
· The current maximum and minimum values of objectives, taken from among all objectives in the project. If there is only one objective, e.g. |S11|, then these will be the highest and lowest values of |S11| in the chosen optimisation Sub-range. If Max Objective in a particular optimisation run has reached the lowest value from among all Max Objectives for the results in cache, it is marked with an asterisk. Similarly, if Min Objective in a particular optimisation run has reached the highest value from among all Min Objectives for the results in cache, it is marked with an asterisk.
Finally the Optimiser Info shows that a particular Stop Criterion has been fulfilled and displays the best set of variables.