Power Available from the source
QuickWave allows the user to obtain a precise information about the actual spectrum of the selected excitation pulse. This is available through the post-processing called Power Available. It invokes calculations of the Fourier transform of excitation waveform of all sources. The result will be a square root of time-maximum spectral power (sqrt(Pav)) at each frequency point; when displayed in square scale (available in the software), it will be time-maximum spectral power in Watt. Power Available essentially amounts to applying FD-Probing on source signals.
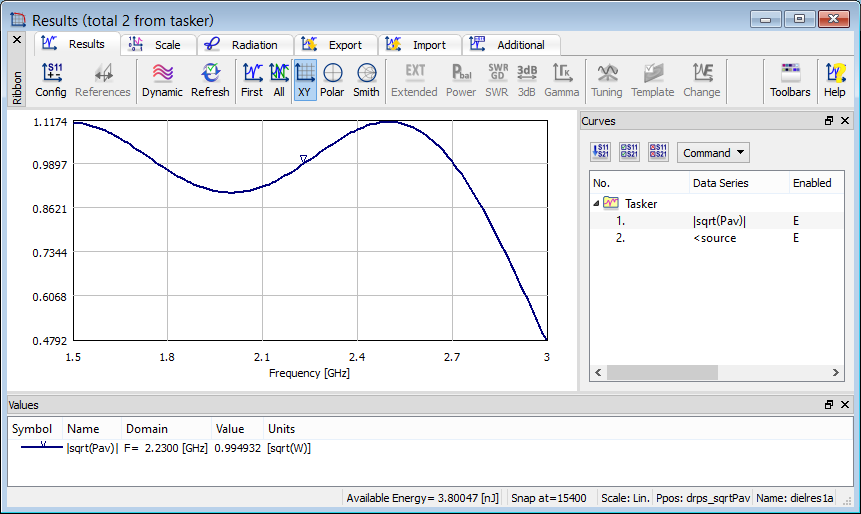
Having the curve of square root of time-maximum power available versus frequency becomes very convenient when it is needed to compare the resulting field values in the structure to the input signal.
Power Available results contain two curves: square root of the time-maximum power available (|sqrt(Pav)|) and the phase of the source signal (<source).
For a plane wave box, the curve will be named sqrt(Sav) instead of sqrt(Pav), and denote the available power density of the incident wave.
sqrt(Pav) and sqrt(Sav) denote time-maximum values of the corresponding available power and available power density. Time-averaged values can be obtained by dividing these results by two.