|
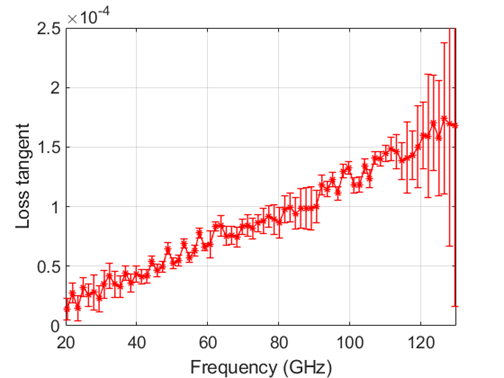
10 – 130 GHz* |
|
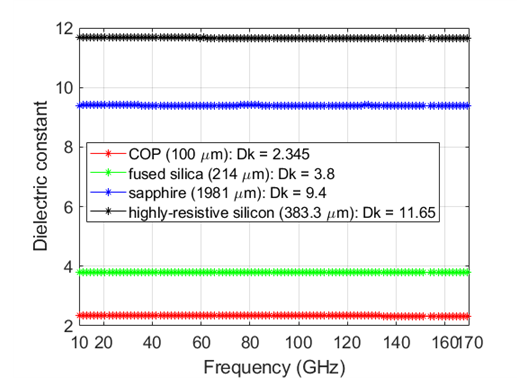
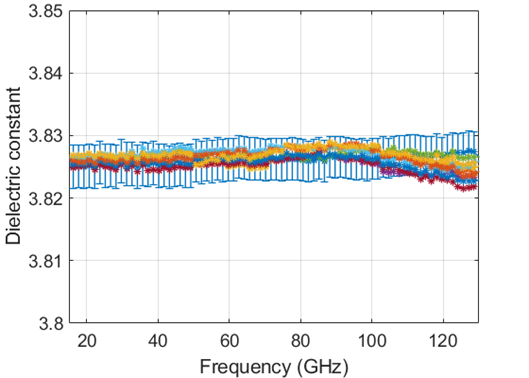
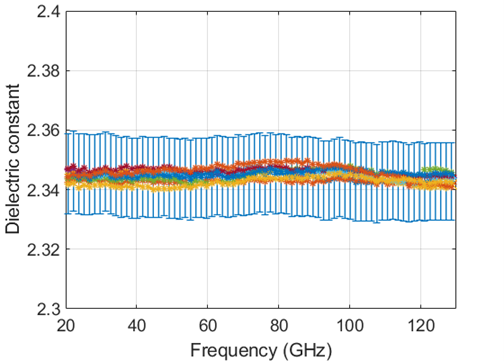
Dk = 1 – 15 (achievable accuracy ± 0.2 %) |
|
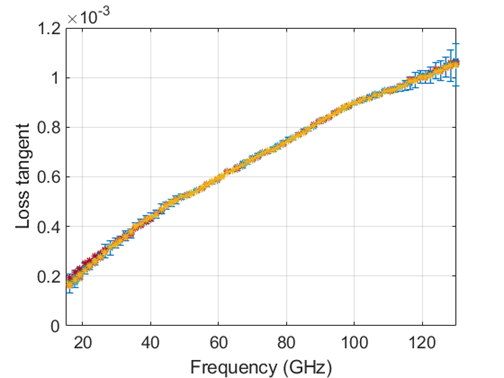
Df > 5 × 10⁻⁶ (achievable accuracy ± 2 %) |
|
1 µm – 3 mm |
|
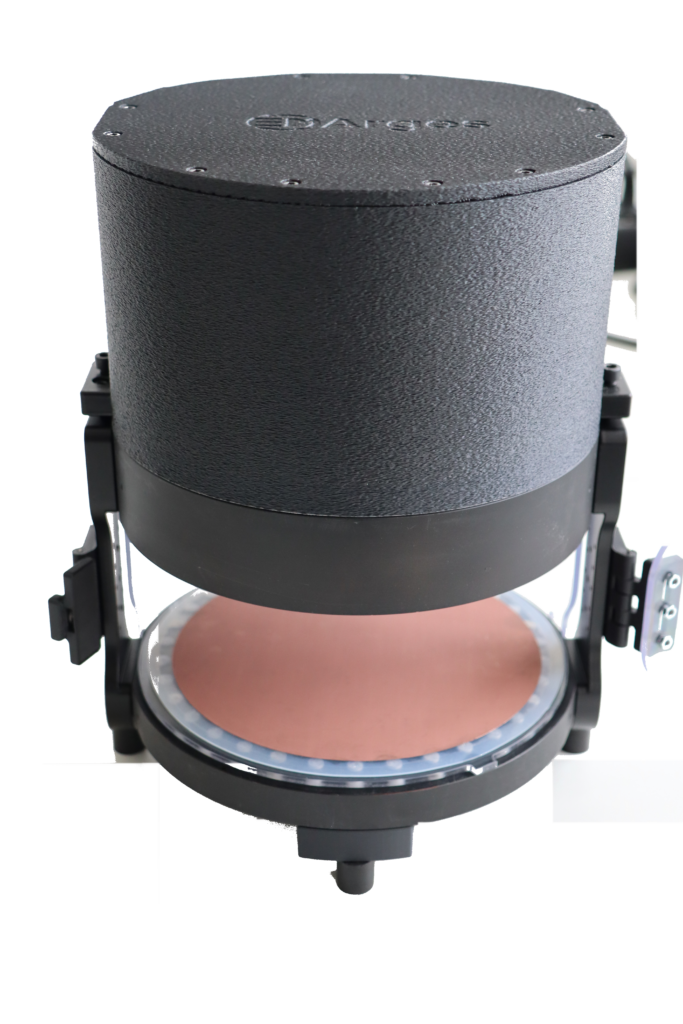
50 – 150 mm |
|
> 1 minute |
|
room, 0 – 80 °C (on request) |
|
|
|
|
*Available also in various frequency-range configurations (e.g. 10 – 26.5 GHz, 10 – 43 GHz, 10 – 50 GHz, 10 – 67 GHz, 10 – 110 GHz, etc.)
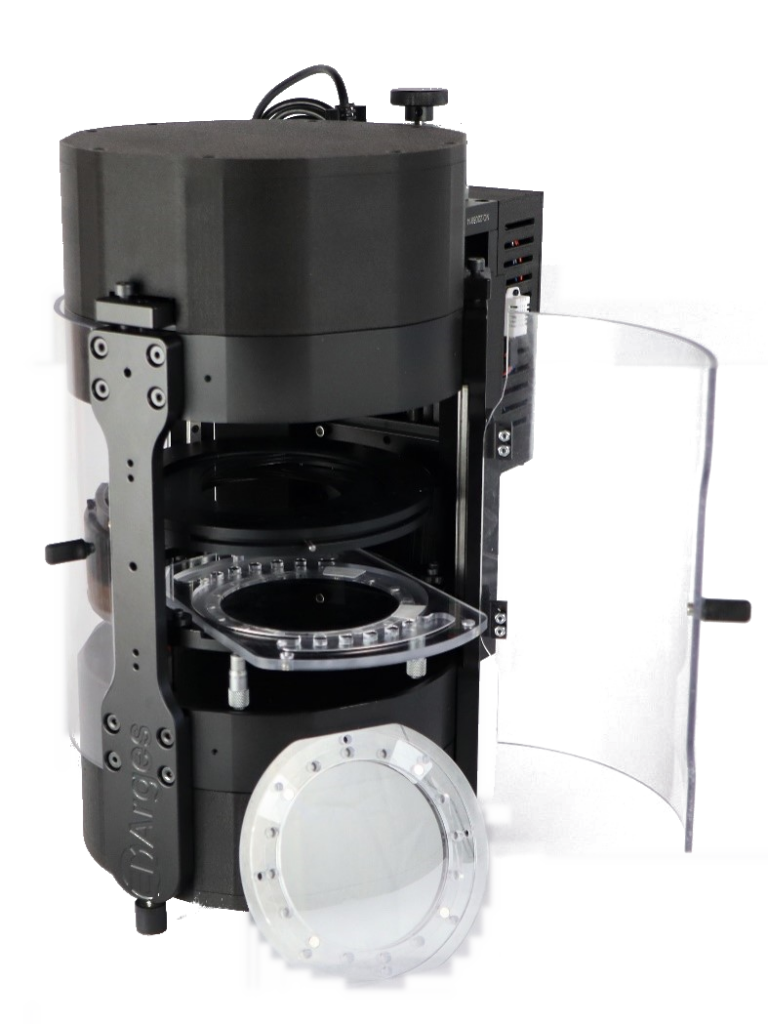
Now available – D-Band Fabry-Perot Open Resonator up to 170 GHz
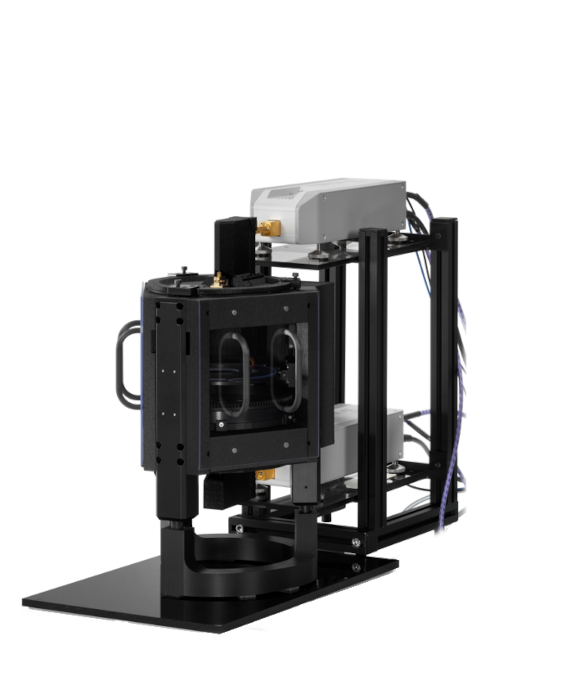
Overview
 |
 |
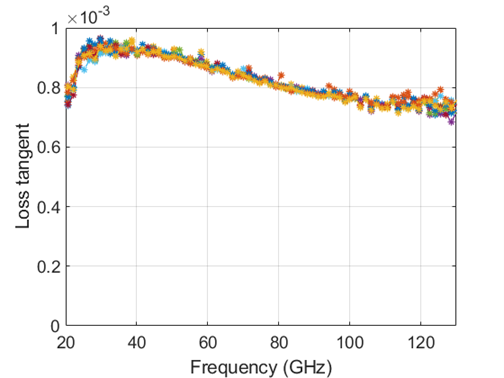
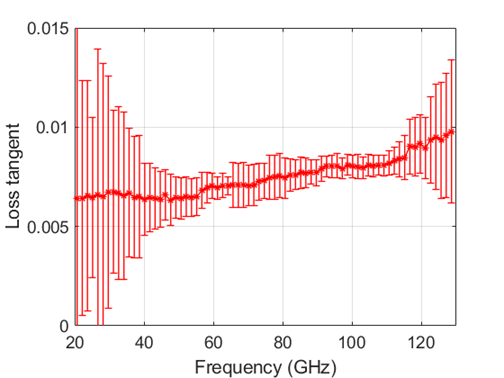
Repeatability
 |
 |
 |
 |
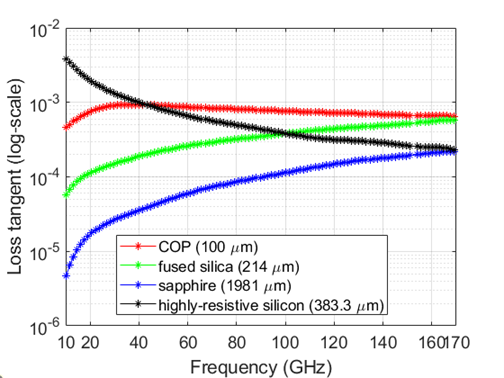
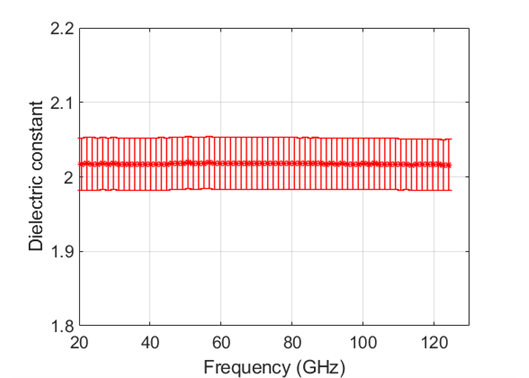
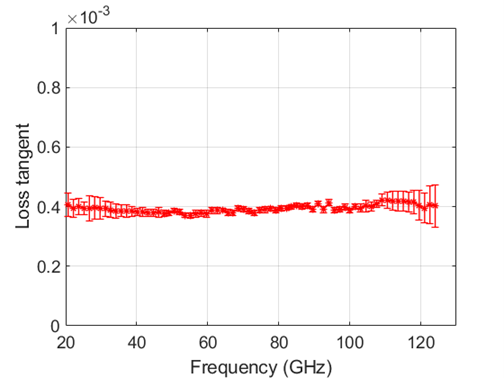
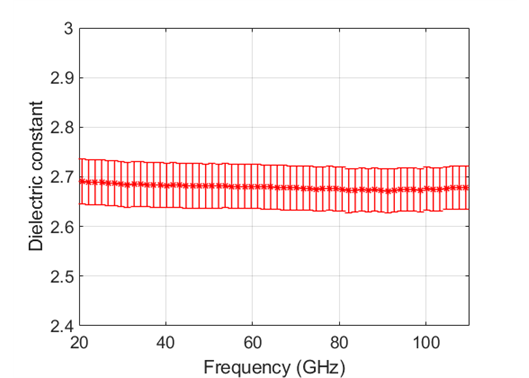
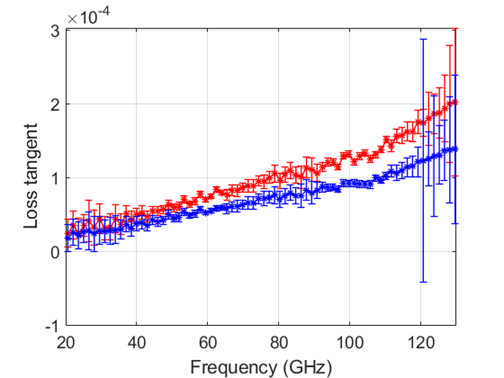
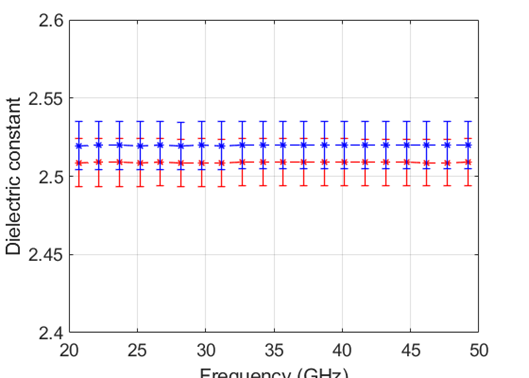
Polymers
 |
 |
 |
 |
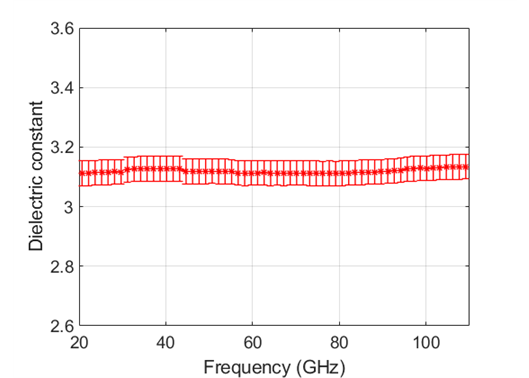
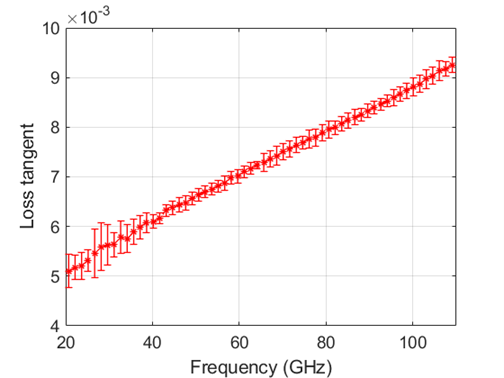
Ultra-thin films
 |
 |
 |
 |
 |
 |
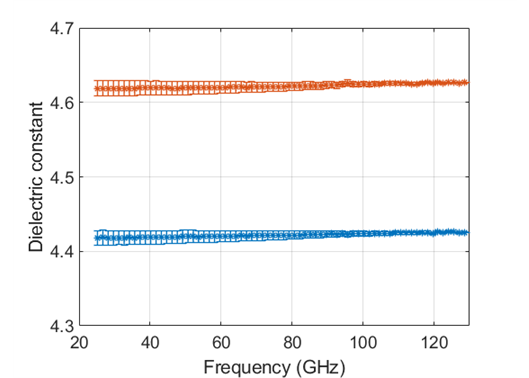
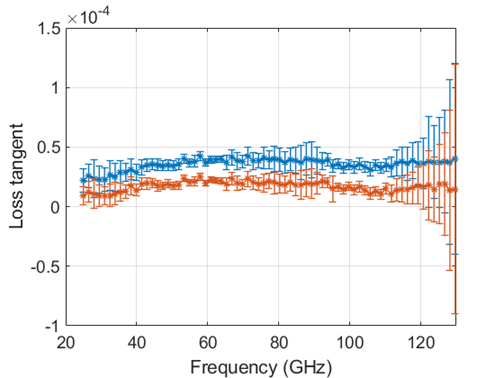
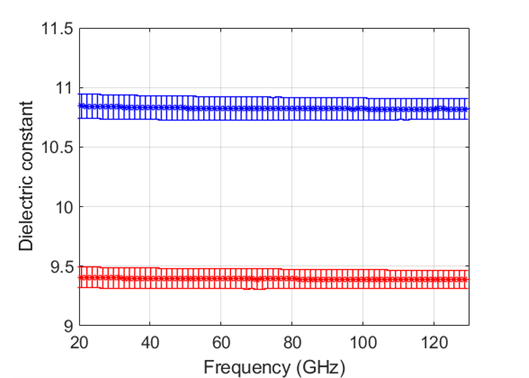
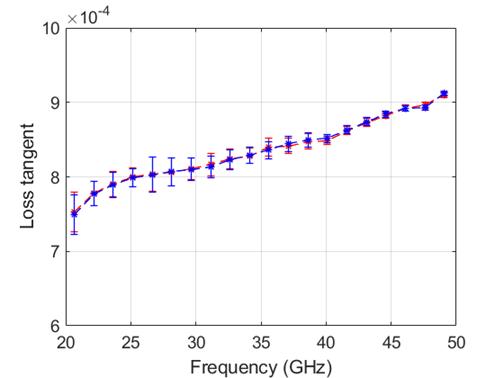
In-plane anisotropy
 |
 |
 |
 |
 |
 |
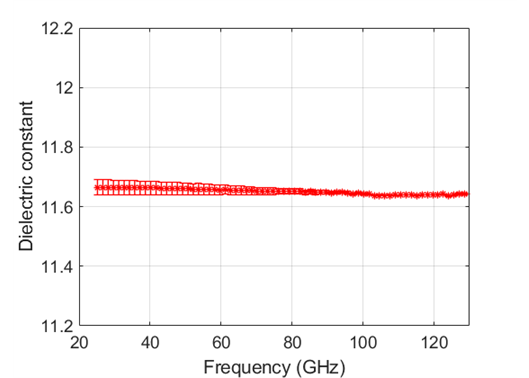
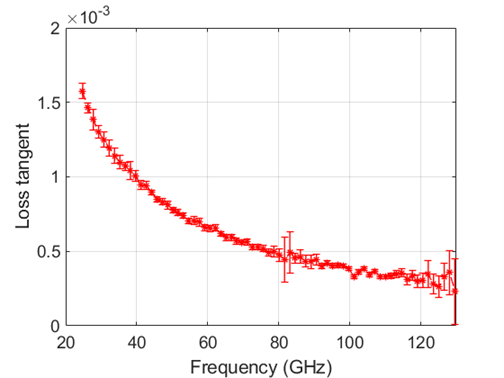
Highly-resistive semiconductors
 |
 |
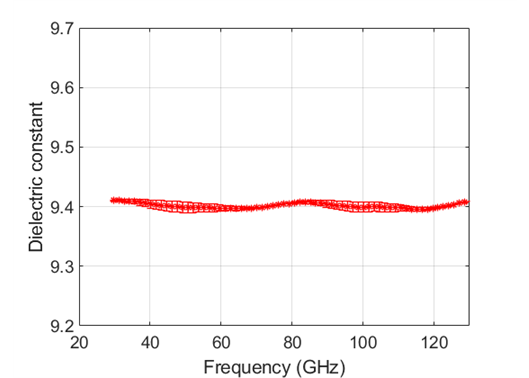
Electrically-thick samples
 |
 |
 |
 |
 |
 |
Link to contact us via form: