|
1.1 – 15 GHz* |
|
Dk = 1 – 100 (accuracy ± 0.15%) |
|
Df > 2 × 10⁻⁵ (accuracy ≤ 2%) |
|
ρ = 102 – 104 Ω·cm |
|
0.6 – 6 mm (depends on frequency) |
|
14 – 120 mm |
|
< 30 seconds |
|
0 °C – 125 °C |
|
IEC 61189-2-721 (04-2015); IPC-TM-650 2.5.5.15 |
|
|
|
|
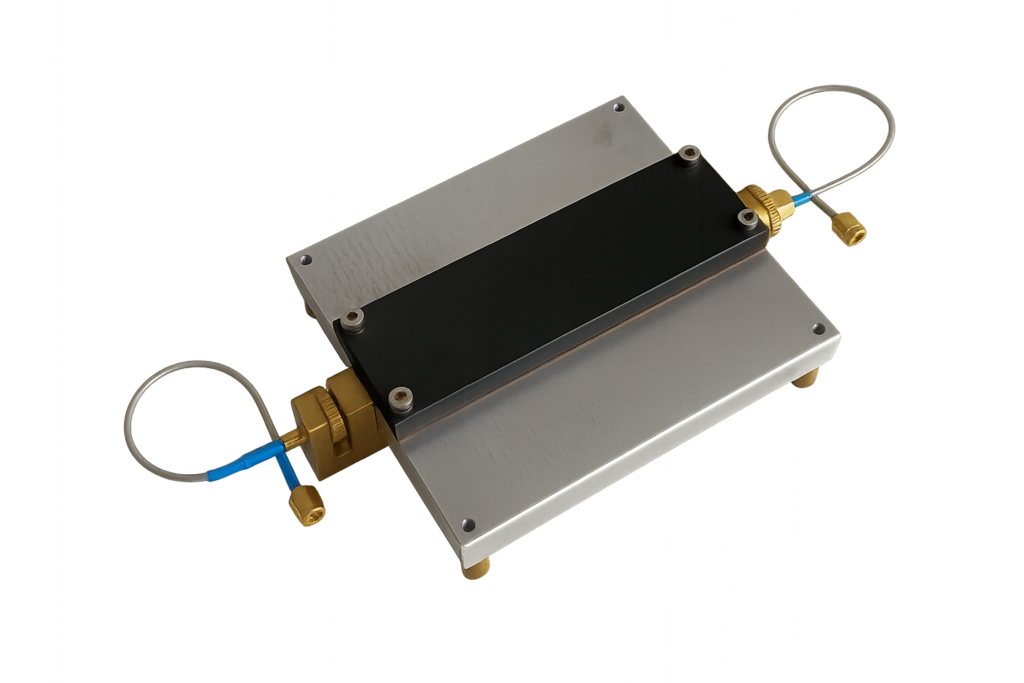
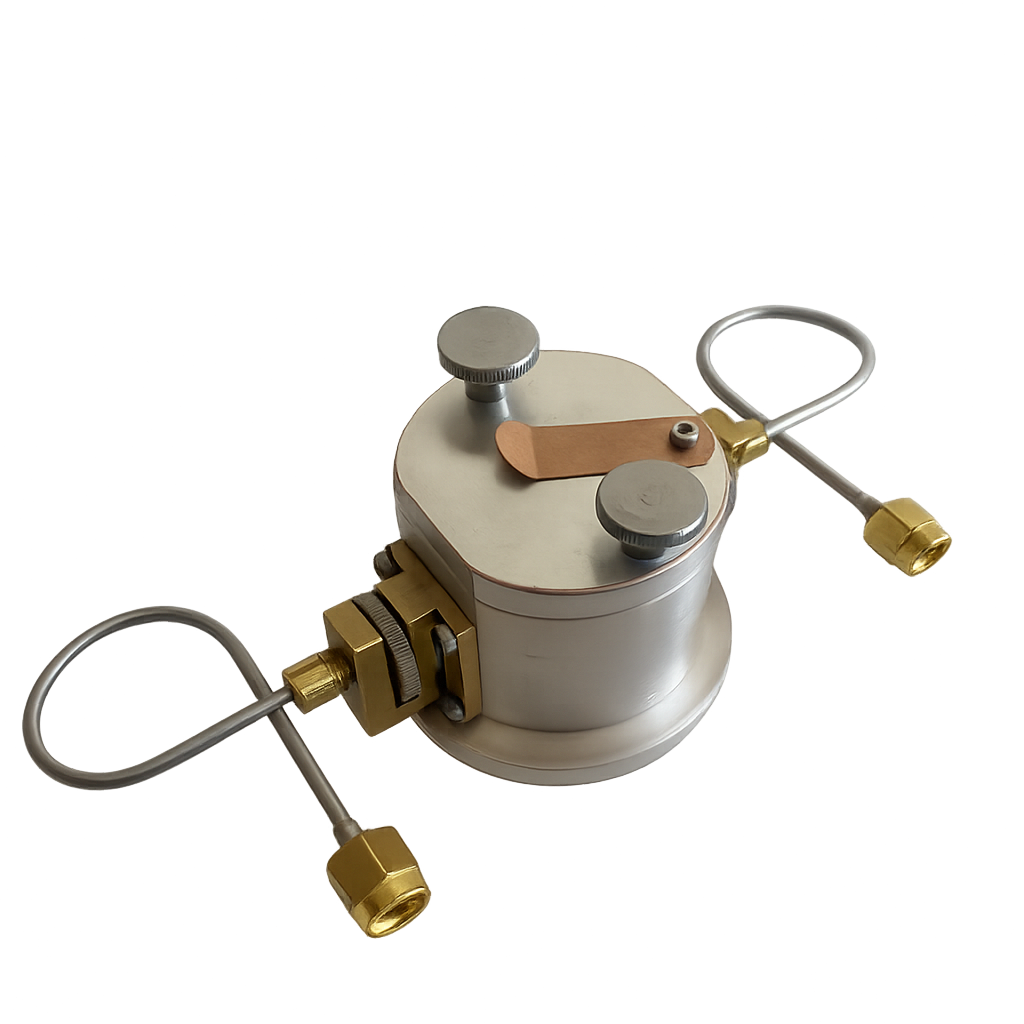
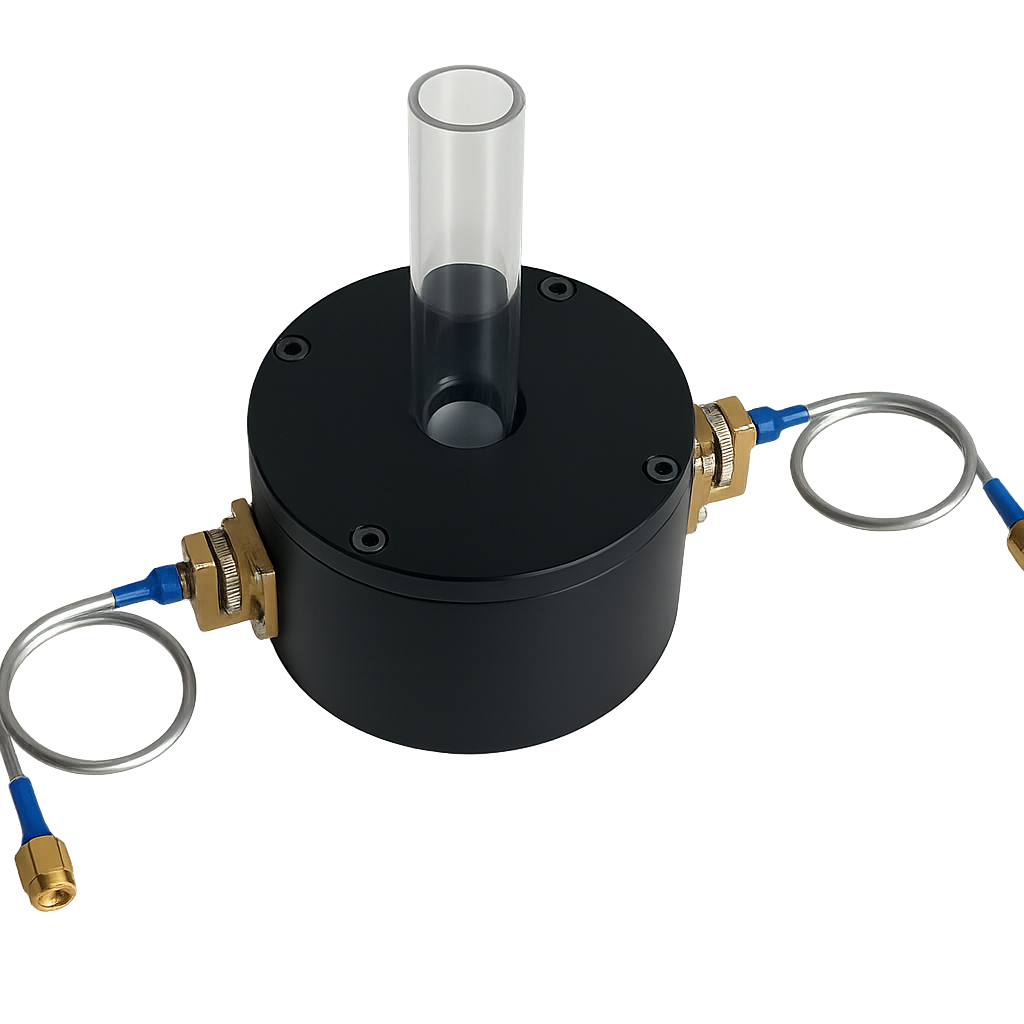
*Each SPDR is manufactured for a single nominal frequency (1.1, 2.45, 5, 10 or 15 GHz). Other frequencies within 1.1 – 15 GHz are available on request.
Discover the low-cost Microwave Q-Meter for SPDR measurements →
| Nominal frequency [GHz] | Minimum sizes/diameter of sample (dmin) [mm] | Maximum width of sample (dmax) [mm]*^ | Recommended sizes of sample (drec) [mm]** | Maximum thickness of sample [mm] |
|---|---|---|---|---|
| 1.1 | 120×120 / 120 | 165 | 165 | 6.0 |
| 1.9 | 70×70 / 70 | 100 | 90 | 4.00 |
| 2.45 / 2.5 | 55×55 / 55 | 100 | 85 | 3.1 |
| 5 / 5.1 | 30×30 / 30 | 90 | 65 | 1.95 |
| 10 | 22×22 / 22 | 90 | 45 | 0.95 |
| 15 | 14×14 / 14 | 40 | 35 | 0.6 |
* Limitation for diameter of circular samples. For rectangular samples, limitation relates only to one sample dimension (the other dimension may be larger).
** For easy sample handling, diameter d of circular sample is recommended to be drec < d < dmax. For rectangular samples of size a × b, the recommendation is a > drec while dmin < b < dmax.
^ For non-standard sample sizes contact QWED team.

Link to contact us via form: