2.17.3 Eigenmodes in photonic crystals (PhC)
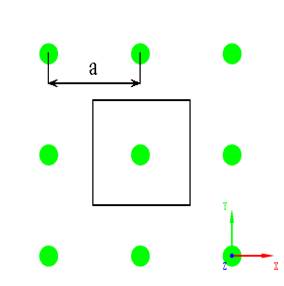
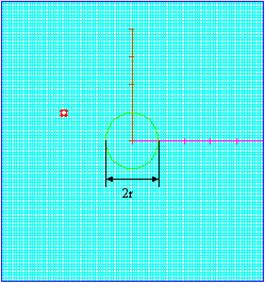
Periodic boundary conditions (PBC) have been introduced in Plane wave excitation as a method for the plane wave scaterrometry of periodic structures. Another scope of applications for PBC is related to the analysis of eigenvalue problems. Eigenmodes usually refer to the resonating modes of the considered structure and each of these modes is associated with a specific wave vector, called eigenvalue. Many physical structures are periodic, like photonic crystals (PhC). We will show how to take the advantage of PBC for the extraction of eigenmodes in PhC consisting of the infinite lattice of dielectric GaAs rods of radius r = 1 μm and lattice constant a = 10 μm (see Fig. 2.17.3-1).
Fig. 2.17.3-1 Infinite rectangular lattice of GaAs rods (r = 1μm, a = 10 μm) and its model (right).
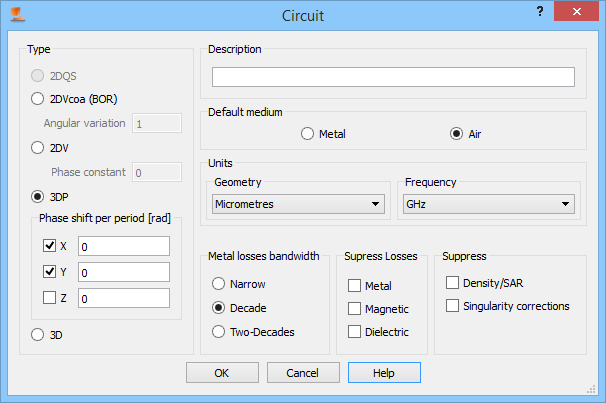
Fig. 2.17.3-2 Circuit dialogue window of phc_2d_rods.pro.
Open example ...Scattering\Periodic\phc_2d_rods.pro. The model consists of one period of the lattice. Red point in the Fig. 2.17.3-1 indicates the excitation point. The aim is to find TM modes with Ez polarization that satisfy the phase shift per period yx = yy = 0 rad but with no phase variation along the rods (perpendicular to the picture). Hence, the model may be reduced to one FDTD layer with electric boundary conditions at the top and at the bottom. Now, we set the previously assumed phase shift per period in XY plane invoking Circuit window (![]() button in Model tab of QW-Editor) and putting them in the appropriate fields (see Fig. 2.17.3-2).
button in Model tab of QW-Editor) and putting them in the appropriate fields (see Fig. 2.17.3-2).
The structure is excited with a wideband delta signal to perform a Fourier transform of the injected electric current. Consequently, we will observe several resonances indicating eigenmodes (results invoked upon pressing ![]() button in Results tab of QW-Simulator) that satisfy the imposed phase shifts per period (see Fig. 2.17.3-3).
button in Results tab of QW-Simulator) that satisfy the imposed phase shifts per period (see Fig. 2.17.3-3).
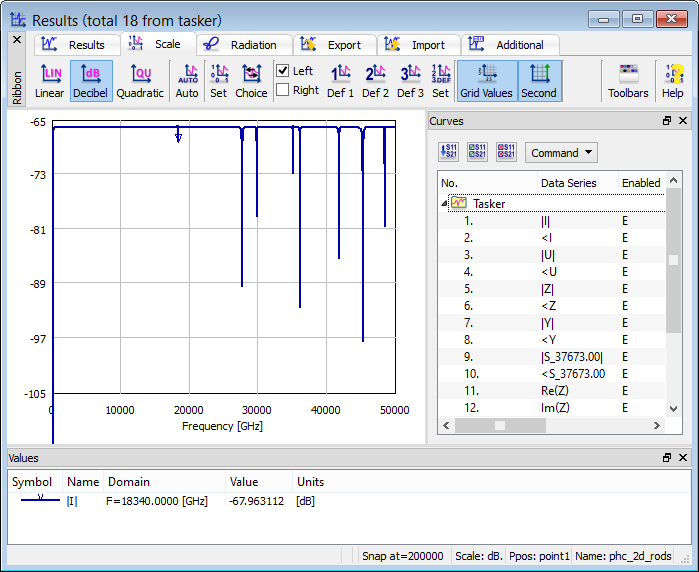
Fig. 2.17.3-3 Spectrum of the injected electric current of phc_2d_rods.pro (yx = yy = 0 rad).
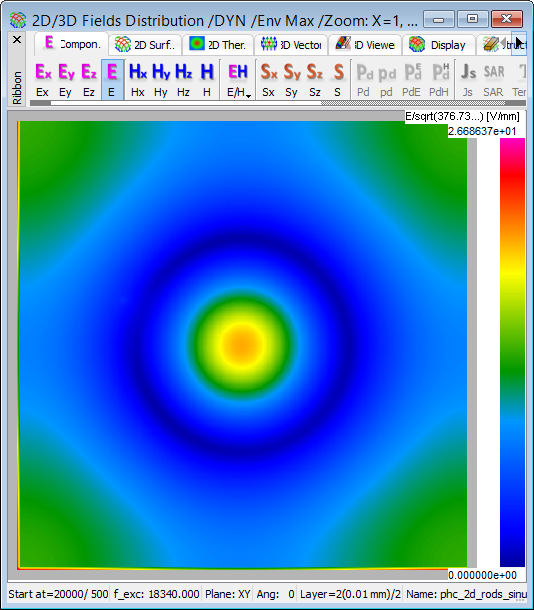
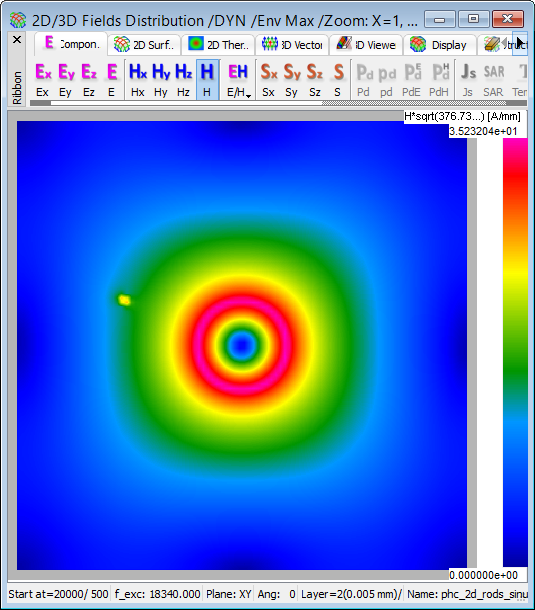
Fig. 2.17.3-4 Envelope of the electric (upper) and magnetic (lower) components at f = 18.34 THz (yx = yy = 0 rad).
Open then the same scenario in phc_2d_rods_sinus.pro with a sinusoidal excitation at f = 18.34 THz which is the first resonance highlighted in the Fig. 2.17.3-3. Fig. 2.17.3‑4 shows envelopes of the electric and magnetic field components, respectively. As expected, there is no phase shift over the period of the structure along the X and Y axes. However, we may observe that the magnetic component is distorted due to the virtual excitation point, needed to initiate the FDTD analysis. To suppress this perturbation in the field distribution, we may gradually turn off the excitation. Invoke Automatic Z Changing… window by choosing ![]() under
under ![]() button in Run tab of QW-Simulator and press OK (see Fig. 2.17.3-5). We will obtain a similar distribution but without a point source indicated (see Fig. 2.17.3-6).
button in Run tab of QW-Simulator and press OK (see Fig. 2.17.3-5). We will obtain a similar distribution but without a point source indicated (see Fig. 2.17.3-6).
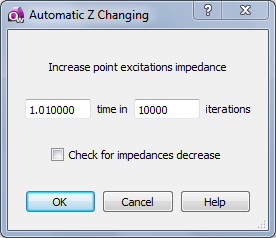
Fig. 2.17.3-5 Automatic Z Changing dialogue window.
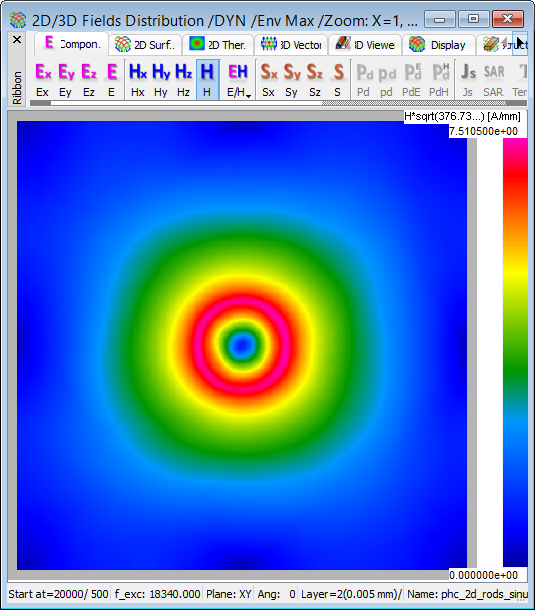
Fig. 2.17.3-6 Envelope of the magnetic component at f = 18.34 THz (yx = yy = 0 rad) but with gradually extinguished excitation.
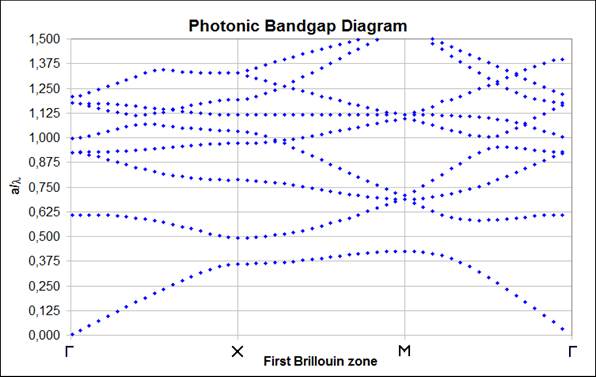
Fig. 2.17.3-7 PBG diagram in the first Brillouin zone of phc_2d_rods.pro.
Follow the same procedure to collect the data for several phase shifts, we will obtain a so called photonic bandgap (PBG) diagram in the first Brillouin zone (see Fig. 2.17.3-7). There is a bandgap within the range a/λ = 0.42 – 0.49 (f = 12.6 – 14.7 THz). It means that no TM mode can propagate in such a 2D lattice within this frequency range. In other words, such a structure may be treated as a very good shield for TM polarization incident at any angle within the bangap range.