5.5.1 Dynamic templates
Dynamic template is used basically for waveguide modes. However, it is also applied for quasi-TEM modes in inhomogeneously filled lines at higher frequencies where dispersion effects become important.
Let us explain the mode generation process for dynamic templates. Each of the ports is associated with a particular mode in the transmission line. Thus for each port we need to calculate a mode template, which will be used for the purpose of:
· Launching the fields of the correct spatial shape when the port is used as a source.
· Separating the part of energy belonging to the particular mode (and thus to the particular port) from the total fields produced by the simulation. This operation is performed during the S-parameters extraction process at the input as well as all outputs.
In most QuickWave examples the automatic process of template mode generation is used. Moreover, in some of them several default settings proposed in the port settings dialogue in the Input Interface were accepted. Such a simple and automatic approach becomes sufficient for the analysis of those circuits. Many users of QW-3D software will never need to look deeper into template generation since the predefined template modes and automatic and analytical procedures of template mode generation will be sufficient for their applications. However, in cases involving higher order modes or inhomogeneous transmission lines the user’s intervention into this process will become necessary.
In this Section we will discuss selected details of template mode generation to gain its basic understanding. The step by step template generation process shown on an example is presented in User Guide 3D: First insight template generation - low-order waveguide modes. In User Guide 3D: Septum polariser as a six-port with higher-order waveguide modes we apply the acquired knowledge to generate higher-order waveguide modes. Further expansion to inhomogeneous waveguides will be provided in User Guide 3D: Modal templates in inhomogenous guides.
5.5.1.1 Physical parameters of template generation:
The mode template is a set of transverse E and H fields of a particular mode considered for a particular frequency f in an infinite section of the transmission line. Such a mode has its particular frequency dependent phase constant b, which for a hollow waveguide can be calculated from an equation:
![]()
where fc is the cutoff frequency of the considered mode. The above dependence of b versus frequency is called the dispersion characteristic of the waveguide. It is graphically exemplified by the dark blue and green curves in the picture below.
For comparison, note that in the case of a plane wave propagation in a dielectric medium we have:
![]()
and thus the dispersion characteristic is a straight line with the slope depending on the material permittivity.
Let us now consider a crossing of the horizontal line of b=bt with the dispersion characteristic of the first waveguide mode, assuming that the waveguide is filled with a material of permittivity e. We can write:
![]()
By analogy to the plane wave propagation in a dielectric medium we can say that for the frequency ft1:
![]()
with an “effective permittivity”:
![]()
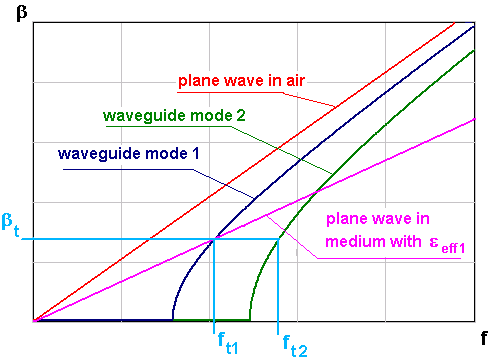
Dispersion characteristics of two waveguide modes (dark blue and green) compared with plane wave propagation in air (red) and plane wave propagation in a dielectric of e eff1<1.
Such an effective permittivity can be illustrated graphically on the dispersion characteristics by a straight line between the origin and the point (ft1,bt), as shown in magenta in the Dispersion characteristics picture above.
Higher modes can also propagate in the same waveguide with the same phase constant bt but at higher frequencies, such as ft2 in the picture above. For the nth mode we have:
![]()
![]()
Note that in the case of waveguides:
· the effective permittivity is always smaller than the relative permittivity of the filling material,
· in the case of air-filled waveguides the effective permittivity is always smaller than unity:
![]()
· for a particular bt the higher the mode, the lower its effective permittivity,
· for any mode and any medium, the effective permittivity is zero at cutoff, and negative below cutoff.
Please also note that templates can be generated only at or above the cutoff frequency.
For some applications, it is convenient to introduce another parameter providing the same information as the phase constant or the effective permittivity. This parameter is called respective free space frequency. It is equal to the frequency frn at which a plane wave in free space propagates with the same phase constant bt as our nth mode in waveguide at the frequency ftn. We thus extend equation ![]() to:
to:
![]()
and we obtain the following relation between respective free space frequency frn and effective permittivity eeffn for nth waveguide mode operating at ftn:
![]()
5.5.1.2 Fundamentals of template generation in FDTD:
To produce the template of the nth mode, we need to simulate the fields in an infinitely long waveguide at the desired frequency ftn. The FDTD field analysis in an infinitely long transmission line can be reduced to the analysis of just one layer of FDTD cells across this line. In other words, it only requires a 2D simulation in the port plane. To this end, spatial derivatives with respect to the longitudinal direction (which now cannot be calculated numerically) are replaced by analytical field multiplication by the phase constant (see ref. [7] [14] for more details). This however implies that a correct pair of the frequency ftn and the phase constant bt must be a priori known. In a general case of arbitrarily shaped and inhomogeneous guides this knowledge is not analytically available, and therefore we need two stages of the numerical analysis:
· finding bt of the particular mode and for the assumed frequency ftn (or a frequency close to it),
· generating of E and H fields of the template for the known pair of values bt and ftn.
The users with mathematical background or earlier experience with eigenvalue solvers may wish to call the first stage “eigenvalue search” and the second stage “eigenmode emulation”. However, they may also wonder how FDTD, which is by nature a deterministic method, can be applied to eigenproblems. In QW-3D we follow an approach presented in ref. [14] [26]. Basically, we introduce an auxiliary point source driving one field component (Excitation field component - substantial in the considered mode) at one point, preferably placed where maximum of this component is expected (for application example refer to User Guide 3D: Septum polariser as a six-port with higher-order waveguide modes). For the predefined low-order waveguide modes, the correct component is automatically chosen by the Input Interface (QW-Editor, QW-Modeller or QW-AddIn for Autodesk Inventor Software). The location of the auxiliary source is marked in Input Interface windows by a red or green dot, for sources and loads, respectively. During the first stage of template generation, a delta pulse is applied, and Fourier transform of current flowing between the auxiliary source and the template indicates eigenfrequencies. During the second stage, sinusoidal signal is applied and the mode pattern is established. More details of QW-3D application to eigenvalue problems are given in User Guide 3D: Dielectric resonator example.
In the case of rectangular or circular homogeneously filled waveguides, the first stage of template generation is simple because the dispersion characteristic of the guide and its cutoff frequency are analytically known. In the case of arbitrarily shaped or inhomogeneously filled waveguides the process of finding bt for a particular ftn becomes iterative, with iterations arranged automatically by the software or manually by the user.
To better understand the consecutive steps of the entire process, we encourage the user to refer to User Guide 3D: First insight template generation - low-order waveguide modes, where the example of template mode generation process, in both automatic and manual manner, is discussed.
As mentioned at the beginning of this section, for dynamic templates, QuickWave provides the user with three template mode generation procedures, which will be discussed in the following subsections.
The template mode generation procedure type is indicated in the QW‑Simulator in the Simulator Log window in the pre-processing stage, separately for each template port. In case of automatic procedure the information listed is:
operation: automatic
In the project's port settings dialogue in the Input Interface, the software is instructed to find a mode at Matching frequency within ± N GHz (listed also in the Simulator Log) with the assumed effective permittivity of the mode. The Simulator Log reports the frequency value (under Mode stability test passed for) at which a mode was found (inside the required range), the respective free space frequency fr, the propagation constant equal to the propagation constant of a plane wave in vacuum at fr, and actual effective permittivity of the mode. The fr frequency is equal to the mode frequency multiplied by the square root of the actual effective permittivity of the mode. It can be checked that the obtained effective permittivity is usually quite close to the assumed one in port settings dialogue.
Usually the operation of template generation in automatic regime succeeds in the first iteration. Otherwise the software would try to modify iteratively the effective permittivity (thus the phase constant) to fulfil the defined in port settings dialogue requirements. That operation would be also reported in the Simulator Log.
During the process of template generation the user can open a Results window in which he can watch a curve of input signal versus frequency with minima indicating the modes. However in most cases the process runs fast and the relevant pictures may be difficult to catch. If we want to watch the details of the template generation we should rather switch to manual template as explained below and in User Guide 3D: First insight template generation - low-order waveguide modes.
At this stage remember that:
· In automatic search for the mode we should assume a frequency range in which the mode should be searched for. It is recommended to assume the frequency range in which only one mode can be detected. Thus if we see two or more modes in the Results window, we should switch to manual operation and choose the correct mode. Otherwise there is a risk that the software will choose a different one. If we want to use automatic search in further runs of the same project, we should set a narrower template mode searching range.
· It may happen that the software detects a minimum at the limit of the assumed template mode searching range. In most cases, such a minimum indicates stopping at the imposed constraints, and does not correspond to a physical mode. QW-Simulator will then issue a warning:
Template frequency has not been found.
Check Template mode searching range or Eigenvalue search iterations.
and the user should extend the template mode searching range.
· The software performs the first search for a mode after N1 iterations. Default value of N1 is 100 periods, which is set in the port settings dialogue in a chosen Input Interface. The periods are automatically calculated to iterations by QW-Editor and exported to the QW-Simulator. This value can be changed by the user in the field "N periods for field pattern generation" in the port settings dialogue. The number of periods, set by the user is also automatically converted by QW-Editor to iterations.
In the next step of automatic mode generation process the cross section of the port is once more excited but this time with sinusoidal signal, at the last calculated frequency of the mode, taking the last assumed propagation constant for the FDTD equations. As a result we obtain the template or in other words the field distribution of the desired mode at the desired frequency.
The process of sinusoidal excitation has three phases, of duration determined by the limit of iterations with sinusoidal excitation introduced by the user in the port settings dialogue:
· In the first phase the port is excited with sinusoidal for N2 iterations (set in the field proceeded by sinusoidal excitation for N2 iterations),
· Further, the source is being gradually disconnected for N3 iterations to avoid field perturbation (set in the field: and source disconnection for N3 iterations),
· Then the software starts comparing the tangential E-field components in the excited cell, to find out which of them dominates. This phase lasts for: 0.1*N2 iterations if (0.3*N2 > 2500), or for (2500-0.2*N2) iterations otherwise.
· Then the simulation will continue for about one more period, with the software looking for maximum of the dominant E-field component (to store the tangential E-fields), and for its passing through zero (to store the tangential H-fields).
The start and end of each phase is also signalled in the Simulator Log. During this process the user can watch the fields of the template mode in 2D/3D Fields Distribution window. Thus he can judge if the mode is the one he has expected and if it is unperturbed. However, note that watching the fields in the mode in which the drawing is updated after each iteration significantly slows down the process of template calculation.
After the template is calculated it is saved on the disk with extension *.tpl. Warning appears if it has replaced another template of the same name. Note that we strongly recommend to the user to store each of the projects in a different directory. Otherwise the templates of different projects but of the same name can be mixed up producing erroneous results of simulation.
The above description considered a case in which the dynamic template in a rectangular waveguide has been calculated automatically. However, in the case of inhomogeneous guides we may have problems with setting the correct effective permittivity or we may expect different modes appearing close to the desired one. In such a case we suggest to follow the advice presented in User Guide 3D: Modal template in inhomogenous guides.
It is worth noting that QuickWave delivers a convenient mechanism for monitoring the process of automatic template mode generation as shown in User Guide 3D: Monitoring of mode template generation in automatic mode.
For Analytical mode generation the software generates theoretical template shape, for a chosen mode, at the matching frequency. A warning will be issued if the matching frequency cannot be found (matching frequency below cut-off frequency for given mode). Using Analytical mode generation the user can set one of the following modes: rectangular TE (Rect_TE), rectangular TM (Rect_TM), circular TE (Circ_TE), and circular TM (Circ_TM) and values of mode indices m and n. Note that for Analytical mode the software assumes that the size of the port matches the size of the waveguide and that the waveguide is filled with air.
In the manual procedure of template mode generation the QW-Simulator lists in Simulator Log the same information as for automatic procedure. The consecutive information appear upon user’s actions. After starting the QW-Simulator the process of template generation starts as before, however, in this procedure of template generation it is required to:
· Open Results window and update the displayed chart by pressing a space bar.
· If the minima of the modes have not yet clearly developed, the user shall wait for some time.
· If a clear minimum appear, the cursor should be moved to it and its frequency should be checked. In the next step it is required to open Template Options dialogue (see left side of the picture below).
· If this is the frequency on which the template should be obtained, the user shall terminate this phase of template generation by choosing the option Set sinusoidal excitation. Note that when clicking the Set sinusoidal excitation, the cursor in the Results window must be at the desired minimum! The sinusoidal excitation will be conducted at the frequency pointed by this cursor, and also shown in the Template Options dialogue.
· If the frequency is not what the user wants, he should use the option Change propagation constant and choose another value of propagation constant which would give us the desired value of the frequency. Three ways of defining the new propagation constant are available:
· as the actual propagation constant in [1/mm],
· as respective free space frequency in [GHz] (a frequency whereat a plane wave in free space would propagate with the same propagation constant as the desired mode, in the considered line),
· as effective permittivity.

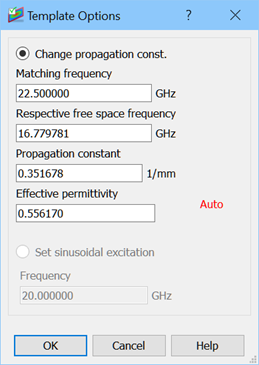
The dialogues used during the manual generation of dynamic template.
Only one of the three values must be reset by the user - the other two will be automatically recalculated for the user’s information. The entire process of the template generation will be restarted using the new propagation constant.
When the Simulator Log signals that the sinusoidal phase of template generation has started, it is required to open 2D/3D Fields Distribution window. It can be seen how the steady state of the field distribution of the mode is being built up. The port orientation is signalled in the window status. After some time a clear mode picture, except (possibly) a sharp ripple at the point where the exciting source is connected, can be seen. This is the time when the user shall disconnect the source. It can be done after pressing the right mouse button, selecting Template Disconnect, and getting the dialogue presented on the right of the picture above. Pressing OK starts the disconnection phase, of duration determined by the user in the port settings dialogue (just like in the case of the automatic template generation). Completing the source disconnection phase ends the template mode generation process.
5.5.1.6 Switching from automatic to manual mode generation
Finally, note that it is possible to switch from automatic to manual mode of template generation without stopping QW-Simulator and returning to Input Interface. While watching the Results window during the first phase of the automatic template generation, we can open Template Options dialogue window (see picture above), however, only the Change propagation constant option will be available). If the user exits the dialogue by pressing Cancel, the mode of operation remains automatic. If he presses OK, an irreversible switch to the manual mode is forced.