NanoBat
GHz nanoscale electrical and dielectric measurements
of the solid-electrolyte interphase
and applications in the battery manufacturing line
Influence of frequency on temperature distribution - LiPF6 in DMC
Download QW-Editor example (ZIP file).
Note: if the link does not open automatically, press right mouse button, choose �Copy link address� and paste it into a new browser window.
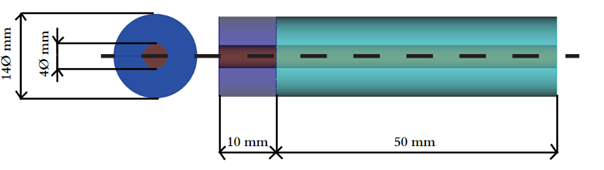
Consider a battery with the following dimensions (see Figure 1). At the center of the system lies the collector, which is considered as a perfect electric conductor (PEC) in the simulation. At the beginning of the system there is a source which is excited at a sinusoidal frequency equal to 10 GHz. A 10 mm air separator also starts from this point. In its middle there is the reference plane of the source. Then the electrolyte is located, which is a lossy material. It is terminated with a special symmetrical boundary condition of magnetic type design - perfect magnetic conductor (PMC). This model is ready for download from the link above.
Fig. 1 Battery model dimensions.
The most interesting area here is, of course, the electrolyte. Scientific publications show that the conductivity of the compound under consideration depends not only on temperature, but also on the concentration of salt in the solvent. The data are shown in the table below. For a concentration of 0.5 mol/kg, the value of electrolyte conductivity is approximated by 0.2 S/m. This is due to the small fluctuations of this value in this temperature range. The conductivity of the material directly affects the power dissipated in it, which, according to equations (see Coupled GHZ Thermal workflow for a battery model article), causes an increase in enthalpy and consequently, temperature. However, attention must be paid to the distribution of electromagnetic fields. It can be clearly seen that as frequency and conductivity increase, electromagnetic fields are more effectively damped, which is related to the physical parameter called penetration depth.
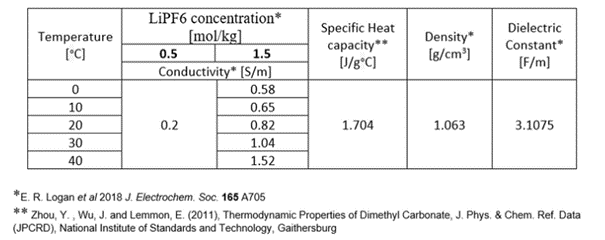
Tab. 1 Lithium hexafluorophosphate (LiPF6) salt in Dimethyl carbonate (DMC) � Electrolyte parameters (*.pmo file available here)
For the simulation, the QW-BHM module was activated along with the heat flow. The maximum heating time in the simulation is 5000 seconds with a step of 100 seconds. Simulations were performed for different frequencies and different salt concentration in the solvent. A good reference in the figure below is the temperature distribution for a frequency of 1GHz, a concentration of 0.5 mol/kg for 100 seconds of heating. Two temperature maxima can be seen there. They correspond to the distribution of the electric field that accumulates along the battery collector. You can see that it has not been fully suppressed. Now increasing the salt concentration, and therefore also the conductivity of the electrolyte. You can see that the temperature rise is slowed down, despite the same electric field distribution. Increasing the frequency to 10 GHz in the first moments of the simulation, the temperature increase at the beginning of the system is greater, despite the same conductivity. However, the electric field is quickly damped and with it the time to full heating of the electrolyte is increased.
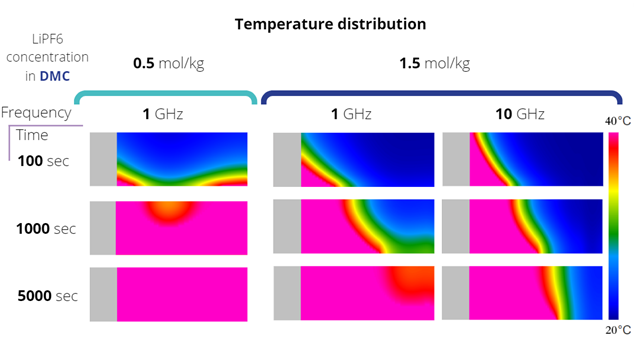
Fig. 2 Temperature distribution for different moments of simulation duration for salt concentration in solvent equal to 0.5 and 1.5 mol/kg and frequencies of 1 and 10 GHz
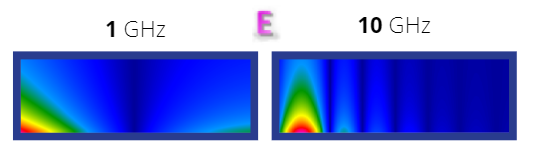
Fig. 3 Electric Field distribution for 1 GHz and 10 GHz
The NanoBat project has received funding from the European Union's Horizon 2020 research and innovation programme under grant agreement No 861962.