2.2 Results Display
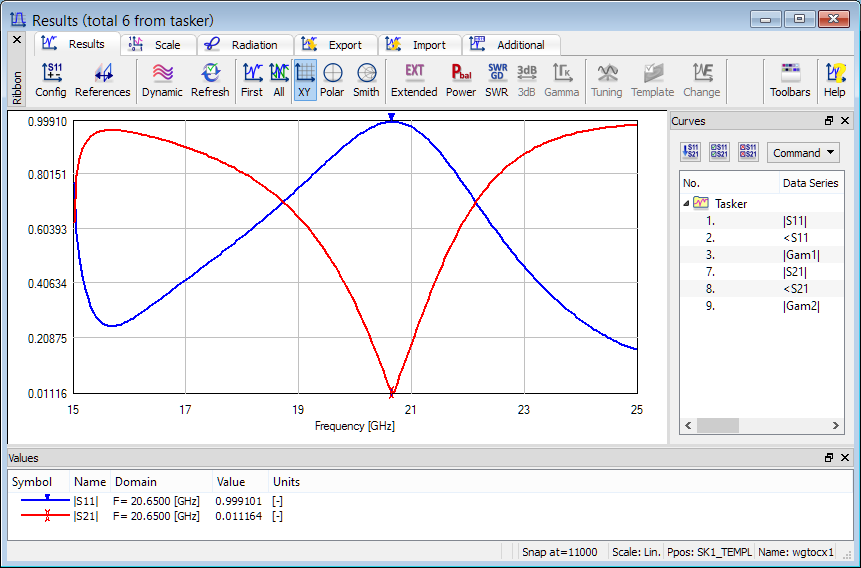
The Results window displays results curves that are set as visible i.e. in Values Pane, Curves Pane or Config dialogue in the specified chart.

Each results curve is represented by line with different colour (it can be changed in the Edit Line dialogue) and at least one cursor (marker). By default, the domain scale and values scale are adjusted automatically to the minimum and maximum value of all visible curves. See Scale chapter for more information.
In the Results display the following general operations are possible:
· use the left mouse button to place the cursor at the desired position,
· use a space bar to update the results,
· use left / right arrows or mouse wheel to move the cursor by one position (one domain point); in some cases this allows more precise cursor control than by mouse operations (mouse operation selects the first coordinate – e.g. frequency point – in the case of several coordinates – e.g. frequency points overlapping at the same point on the screen),
· use Ctrl with left / right arrows or Ctrl with mouse wheel to move the cursor by 10 domain points,
· press Home button or Shift with mouse wheel up to move the cursor to the beginning of the curve,
· press End button or Shift with mouse wheel down to move the cursor to the end of the curve,
· use Alt with mouse wheel to change the active cursor (see Markers chapter),
· use the right mouse button on free space to see the main context menu,
· use the right mouse button on specified region (i.e. near cursor, on scale values, on Label, on Legend, on Delta Markers or on text) to see the dedicated context menu,
· use Config dialogue for adding, removing, and other operations on curves in the display,
· press N key to show next results curve,
· press P key to show previous results curve,
· for XY chart, move the left, right, bottom, and top sides of the chart pane with a mouse, to decrease / increase the relative part of the window occupied by the curves display,
· for XY chart, press Shift and move the whole chart pane with a mouse and left mouse button pressed,
· for XY chart, press Ctrl+Shift and click left mouse button to restore the default display proportions
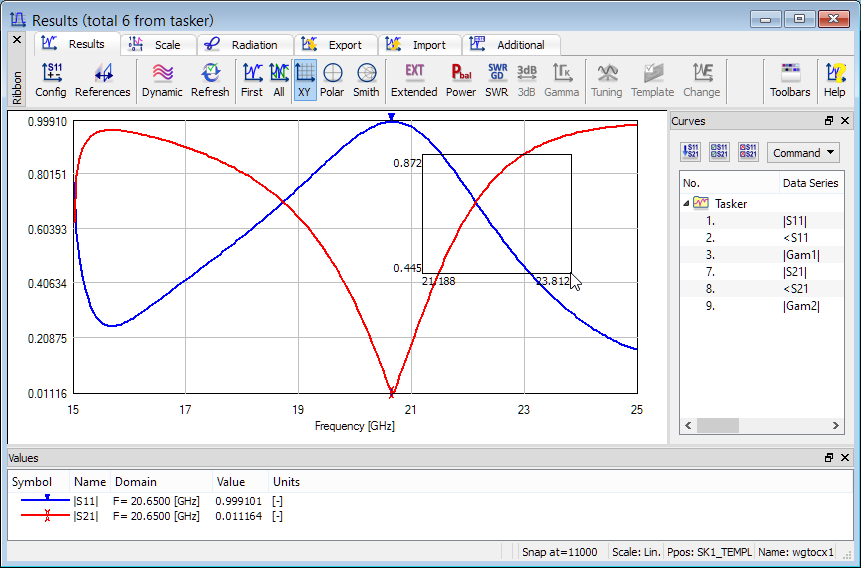
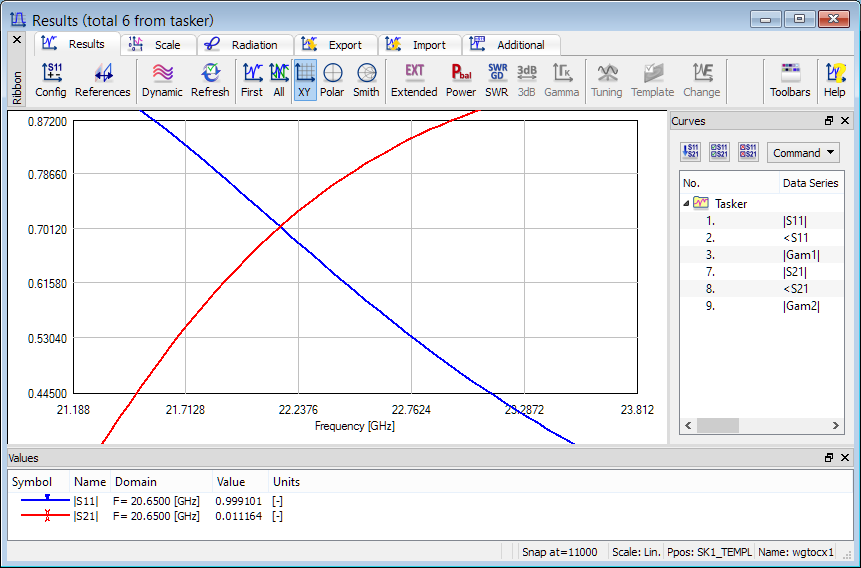
· for XY chart, zoom is available by drawing a rectangle with Ctrl with left mouse button pressed (the scale range will be changed, see also Scale chapter). The rectangle should be drawn from top-left to bottom-right corner. Return to the previous view with Ctrl+Z:

